Process-Based Data Modeling
Data modeling is deceptively easy to get started with. But the fast-paced progress made early on comes to a grinding halt when you realize your model will not accommodate some unforeseen situation or edge case.


Published on
A systematic approach for getting your data model right — the first time.
Data modeling is deceptively easy to get started with. Anyone that has designed a simple table structure in a SQL database has successfully accomplished a data modeling task. But the fast-paced progress made early on comes to a grinding halt when you realize your model will not accommodate some unforeseen situation or edge case.
Uh oh! You’ve painted yourself into a corner! Again. 🤦🏻♂️
I found myself in such a situation more than once. If you have, too, or if you’re simply interested in learning a good process to avoid pitfalls, continue reading for some helpful advice that can significantly improve the quality of data models you produce.
Data Modeling Deliverables
Data modeling is the process of defining and analyzing data requirements needed to support the business processes within the scope of an organization’s IT systems landscape. These data requirements are specified in graphical models we refer to as data models.
A data model explicitly determines the structure of data and defines how it will be implemented. It is usually developed to support a specific software application, system, or service which, in turn, supports, enables, or automates some business process and value stream.
The process of data modeling typically results in 3 deliverables:
- Conceptual Data Model
- Logical Data Model
- Physical Data Model
The Conceptual Data Model is centered in the business domain. There’s no tech-talk. The conversation isn’t about data; it’s about information. What real life concepts are we aiming to model? They need to be identified and defined, along with basic information on how they relate.
The Logical Data Model is much more detailed. Here, you begin to talk about entities. You determine what attributes need to be on each entity to adequately represent the information concepts. And you explicitly define the relationships (one-to-many, one-to-one, etc.) between these entities. What you do not get into are implementation details that presume a particular database technology — that’s what the physical model is for.
The Physical Data Model provides clear instructions on how to implement the logical model with a specific technology: a PostgreSQL database, for example. It will communicate implementation-specific details that the data engineers require to begin their work.
Your job, when data modeling, is to draft a clear and concise model for each of these three layers.
Don’t Skip Any Models!
Most people that have a bit of database experience can intuitively put together a good physical and logical model. That was the case for me, the first time around. My hands-on experience made it familiar and easy to understand so I skipped straight to the physical model, laid out some tables and relations in a SQL database, and patted myself on the back for a job well done. This wasn’t so hard, after all! 😅
Unfortunately, you can probably guess what happened next. Oops! I’ll need to add a couple more columns to that table. And another table over here. And one more relation over there. Repeat ad nauseam. Things started to get a bit convoluted to track and understand. And queries become less and less performant due to changes in access patterns. It didn’t extend well and, in the end, I completely trashed the model altogether and went through the painful process of migrating the data to a new data model that I spent a lot more time planning out.
Over time, through trial and error, I’ve refined an effective process for delivering data models that work. While it isn’t realistic for me to cram all the learnings I’ve acquired into a single article, I don’t believe I need to. Anyone with a good head on their shoulders can deduce a decent data model with a bit of practice. Most people simply don’t know how to get started. They just need someone to show them where to start and to point them in the right direction.
That is what I’m going to do for you, in this article. I’m going to show you where to start and point you in the right direction.
And where we start, dear reader, is with business processes.
The Primacy of Process
If you want your solution to integrate smoothly into the client’s enterprise, you must grasp the primacy of processes. Both software applications/services and the data model exist to enable, support, and automate business processes. Full stop. Start with the processes and work your way out from there.
Get Familiar with Process Maps
Once the project scope is determined, your first job is to identify all of the business processes that will be created or transformed by the project you are working on. After all impacted processes are identified, you must then either obtain a copy of existing process maps or create the process maps yourself.
But it must be done! Every project is a business formation or transformation initiative. And, therefore, it is impossible to know whether your data model will meet requirements if you do not understand how the project is expected to change the business. Furthermore, it’s not likely you will truly comprehend the current state of the business and what will change until you have a working model to understand it through.
If you want to learn to deliver better data models, spend an equal amount of time learning to understand and model business processes, too. Think of it as two sides of the same coin.
Remember PPIT
So how do we model the organization in a way to better understand it? For our intents and purposes, the organization should be viewed from (at least) four perspectives:
- People
- Processes
- Information
- Technology
An organization is comprised of people. Those people execute and support business processes that create value. Those business processes also produce, consume, and transform information. And all three are enabled or supported by technology/infrastructure. If you consider and cover these four bases, you will significantly reduce the risk that you may overlook something critical.
In the steps below, we will start with the process, but as we step through it, we will begin developing our data model by considering the relationships of the other perspectives. Keep PPIT in mind, always, when reviewing the processes and designing the data model.
Tutorial: Learn by a Simple Example
Enough talk. Let’s get to some actionable information and advice. I learn best when working through examples. So, that is how I will illustrate the approach: by working through a simple example.
Quick Note on BPMN Process Maps
The process map example is diagrammed using Business Process Modeling & Notation 2.0 (BPMN), a standardized approach that accommodates modeling of more complex scenarios than flow charts will allow.
I see a lot of people get intimidated when they first lay eyes on a BPMN process map. Please don’t let it scare you. The basics are very easy to pick up and, more often than not, the basics are all you need. Start with only tasks and exclusive gateways, the “boxes & diamonds” of BPMN. Then, watch a few BPMN tutorial videos on YouTube, and you’ll be mapping out more complex processes like a pro in a few days. 😎
Example Process Map: Pizza Delivery
I said that we always start with the process. For our example, we will be using a very simple BPMN process map for pizza delivery. A process you have likely participated in a few times before, no?
Take a moment to review the process map to ensure you understand it. I’ll talk you through it:Take a moment to review the process map to ensure you understand it. I’ll talk you through it:
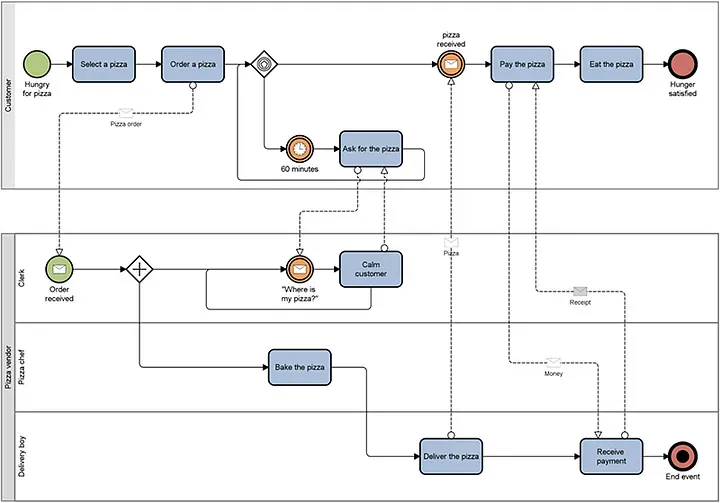
- Starting with the green dot in the top left, a customer selects and orders a pizza.
- At that point, the customer goes into a “holding pattern” while the pizza vendor’s clerk starts their service delivery process.
- The store-side process kicks off when an order is received. The process splits into two parallel paths: the clerk handles customer interactions while the chef is baking the pizza and the driver delivers the pizza.
- Once the pizza is received by the customer, a payment is made and the customer eats the pizza.
If you don’t have a standardized BPMN diagram, that’s okay. Just ensure you have it sketched completely in a way everyone understands. And remember that something is better than nothing.
With a process map in hand, you’re ready to take on your first tasks: identifying information concepts and building a conceptual model from them.
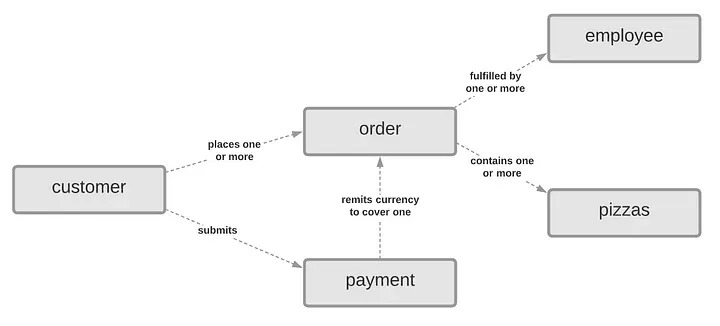
Conceptual Data Model
Your first task while reviewing the process map is to glean all of the information concepts you are dealing with. On my first pass, I wrote down the following five concepts: customer, employee, order, pizza, and payment. You can certainly catalogue more, but I think that’s enough for a learning example.

Now, draw lines showing the relationships between the concepts. The relationship descriptions are generally read in the direction of the arrow. For example, if I were to look at order and employee, I would read the relationship as “an order is fulfilled by one or more employees.” If I were to consider the relationship from customer to payment to order, I would read it as “A customer submits a payment to cover an order.” Get the idea? We want to use natural, business-oriented language when describing the relationships.Now, draw lines showing the relationships between the concepts. The relationship descriptions are generally read in the direction of the arrow. For example, if I were to look at order and employee, I would read the relationship as “an order is fulfilled by one or more employees.” If I were to consider the relationship from customer to payment to order, I would read it as “A customer submits a payment to cover an order.” Get the idea? We want to use natural, business-oriented language when describing the relationships.
Once you feel you have identified and defined all of the necessary concepts and how they relate, open up a spreadsheet. It’s time to document a few things.
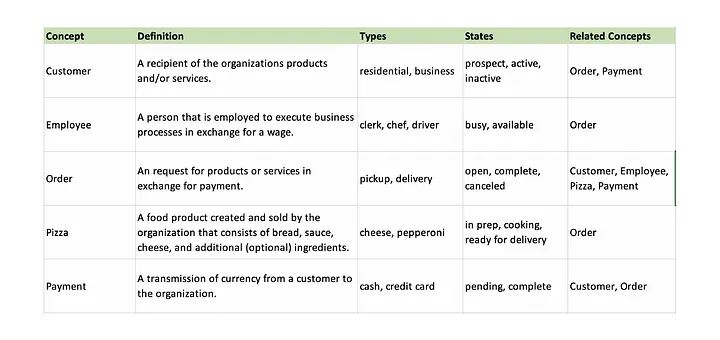
Information Concept Dictionary
An information dictionary is a simple Excel table where we get everyone to agree on what all these concepts really mean, in what different modes, types, and/or states they can exist, and how it is related to other concepts that were identified. In practice, this is generally developed in parallel with the conceptual data model.
This is a very important step that many people skip. Don’t skip it. It is very easy to talk past each other which results in overlapping concepts that don’t have clear definitions. It’s easy to clear this up now. It will be very painful and expensive to clear it up later. Do it now.
The output of this exercise should produce something like you see below. Feel free to add additional columns, if necessary.
With the information dictionary complete and a conceptual data model already sketched, you have what you need to begin drafting the logical data model.
Before moving on ensure you cross-reference your information dictionary and conceptual data model with each other, with the process map, and with all process stakeholders. Listen particularly closely to the employees that actually execute the processes every day — they are your domain experts.
Logical Data Model
It may have taken a bit of effort to develop and ratify the information dictionary with process stakeholders, but here is where it pays off. When you couple the information dictionary with the process map, you can begin to sketch out a schema with a much higher degree of confidence.
As a first pass, add the obvious attributes to each entity from the information dictionary. Then, step through the process map and, for each task, ask yourself what information is consumed or produced in that step. Think about the relationships required to query the data needed for each step. The required attributes and common query access patterns should begin to emerge.
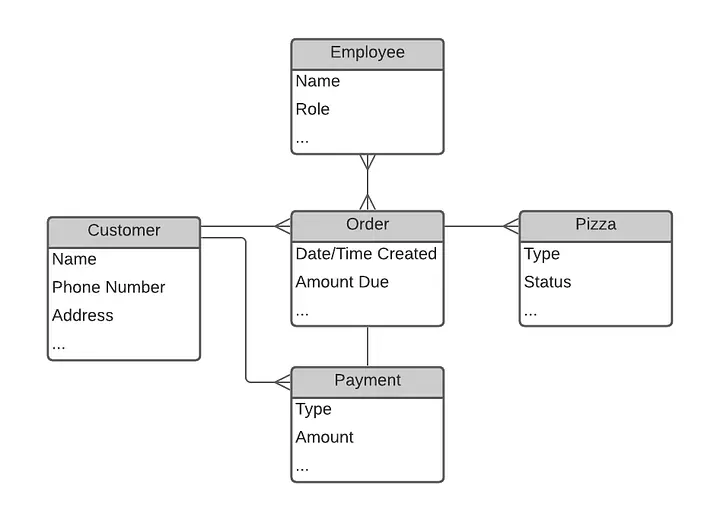
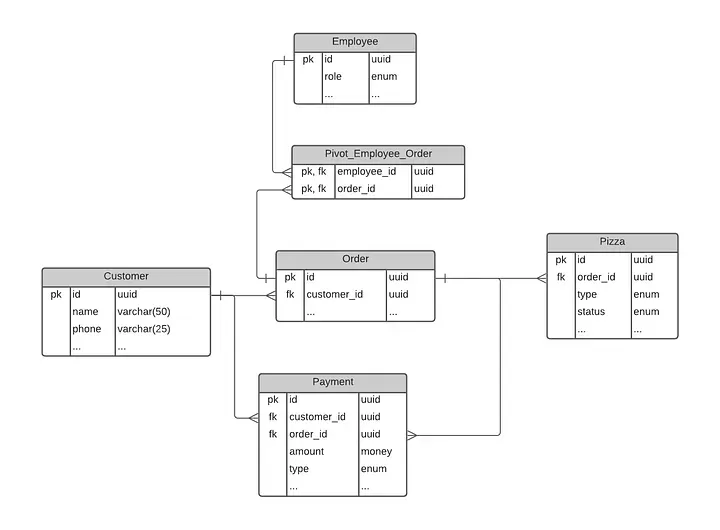
When you finish, you should have something close to what you see in the example above. Entities should have all attributes identified and the relationship types (one-to-many, one-to-one, etc.) should be defined, as well. With this logical data model in-hand, you should be able to create an implementation-specific physical data model with ease.
Before moving on ensure you cross-reference you logical model with the information dictionary, conceptual data model, and process map(s). Also, if you haven’t already decided on a particular database solution, use the logical data model to determine which would be the best fit.
Physical Data Model
The physical data model usually looks very similar to the logical data model, except that it focuses on the information necessary to implement the logical model using a particular database technology. In fact, that is the sole purpose of the physical data model: to provide clear instructions for how the logical data model should be implemented using the chosen database technology.
What makes a good physical model will differ a bit, depending on the database technology you have selected. But, it’s easy to know when you are finished: your DBA or Data Engineer has the information he or she requires to implement the model. That’s the purpose of this model. If you’ve got that covered, you’re good-to-go.
In addition to specifying the data type of each attribute, you will also need to define indexes to accommodate relationships, common query patterns, and data integrity rules. You may also need to add attributes and tables that do not exist in the logical data model. That’s expected. For example, to implement a many-to-many relationship in Postgres, a pivot table must be added in between the tables you are joining.
Remember that the purpose of the physical model is to translate the logical model into a specific implementation. Finished means that the logical model is accurately represented, and all information required to effectively implement the model is present. Don’t waste time going beyond that, but don’t stop short of that, either.
Recognize Success
If you run into issues, get the right people in a room and hash it out. If some unforeseen constraint forces you to revisit the logical data model and make updates, it’s not the end of the world. Just the opposite, in fact! It means your models are doing their job. These models are created to facilitate communication. In a situation like this, you didn’t make a mistake; you identified a problem and corrected it before the implementation began. Pat yourself on the back. You are providing value to your team and organization. 🍻
Conclusion & Next Steps
If you’re anything like me, the details of data modeling were never hard to pick up. The problem — at least for me — was that it was too easy for something to be overlooked or remain unconsidered. The reason that risk materialized repeatedly was because I didn’t fully grasp the context. I needed to go beyond data models and also understand the business and process models, too. I was missing “too many pieces of the puzzle to see the big picture,” so to speak.
This article provided insight on the context and considerations required to develop good data models, including a high-level approach that incorporates best practices. I said that the aim of it all was to give you a good place to start and to point you in the right direction. That remains true, but I also hope that I’ve sparked a bit of motivation in you to learn more about process modeling and business architecture.
If you would like to dive deeper into some of the topics I touched on in this article, here are a couple of good starting points:
Best of luck on your journey to excellence in data modeling! 🙂